


Call Center Software
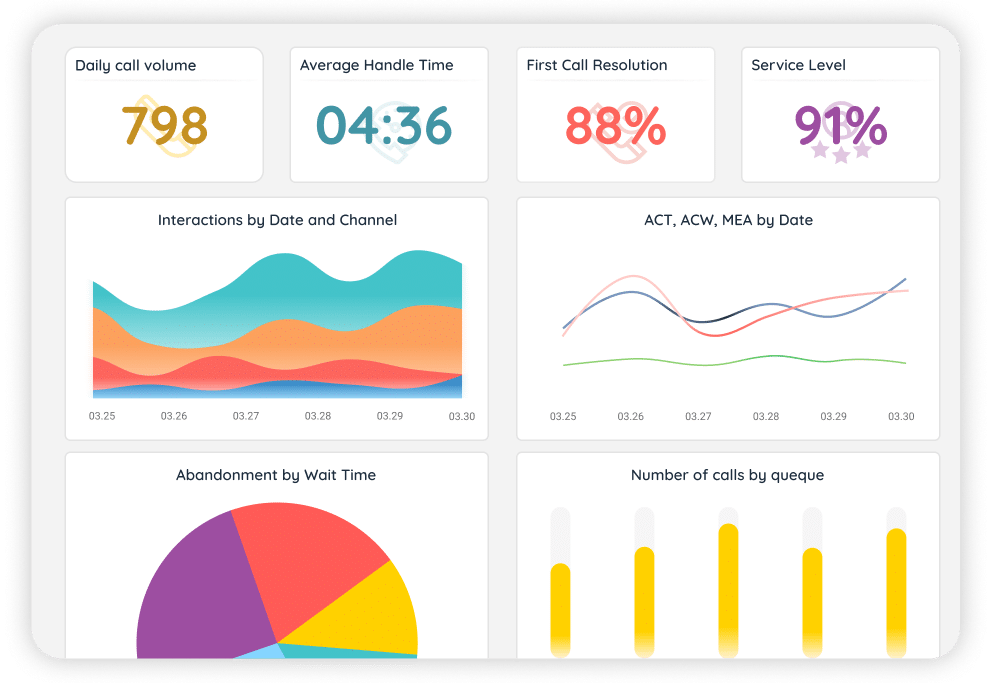
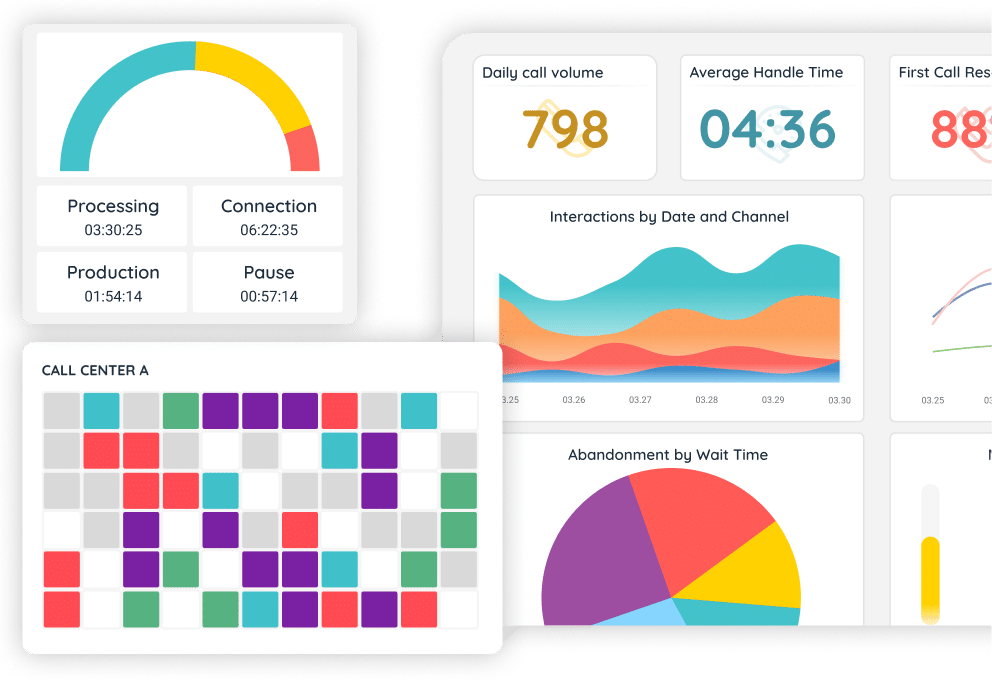
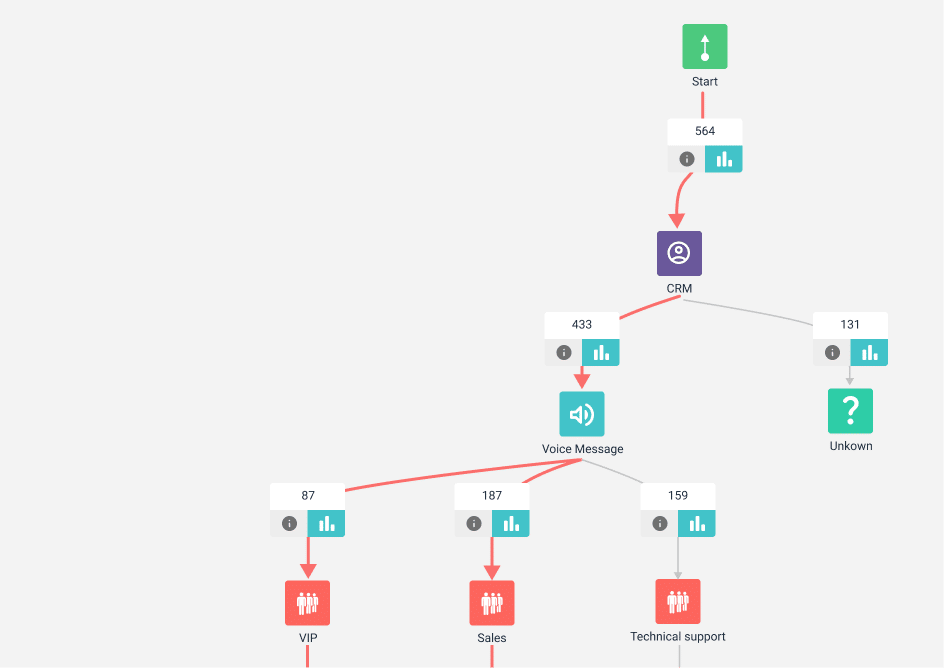
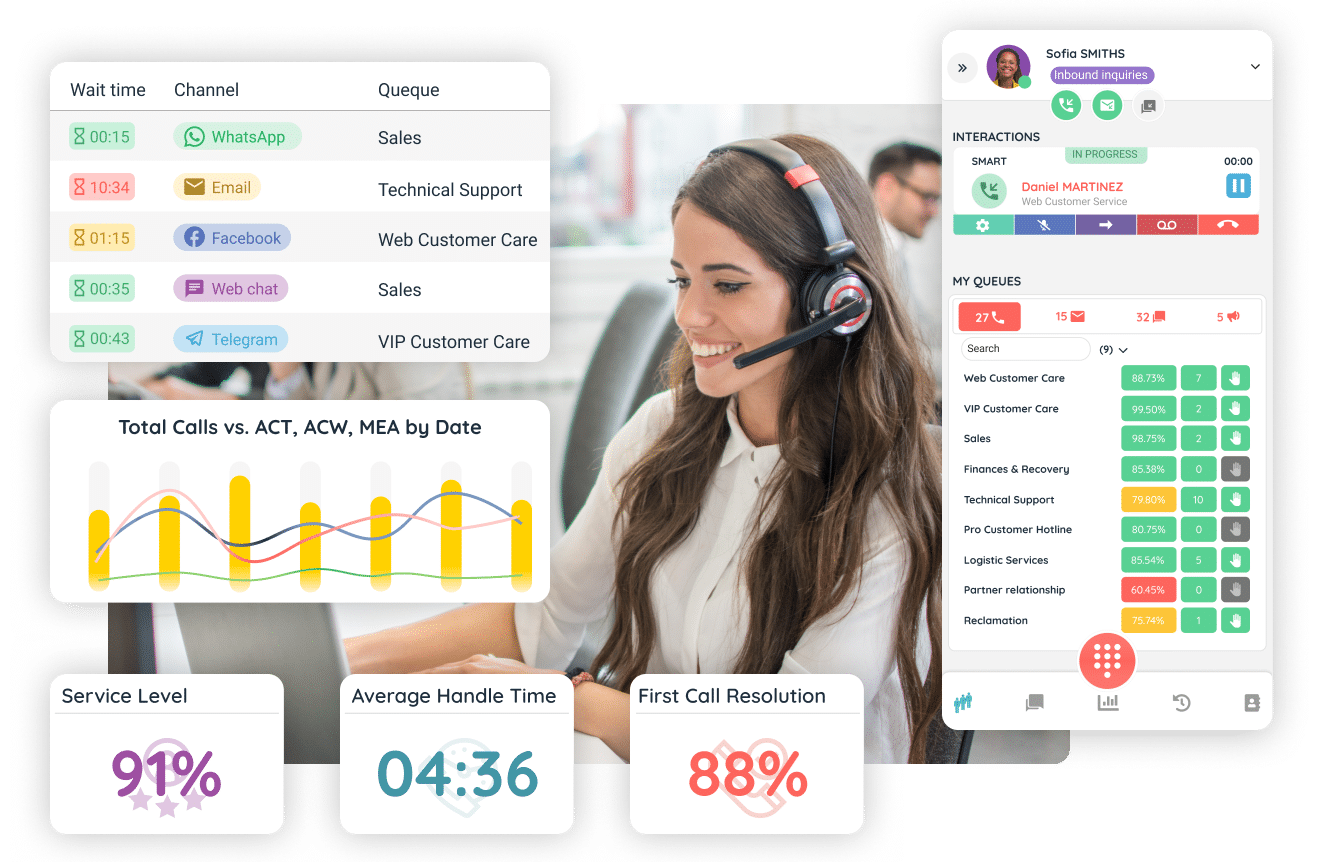
Discover INO CX, powerful call center software for inbound, outbound, and hybrid teams. Boost productivity, gain real-time visibility, and deliver better customer service across voice, email, SMS, and messaging.
Learn more